* These images may include radio wave propagation delay.
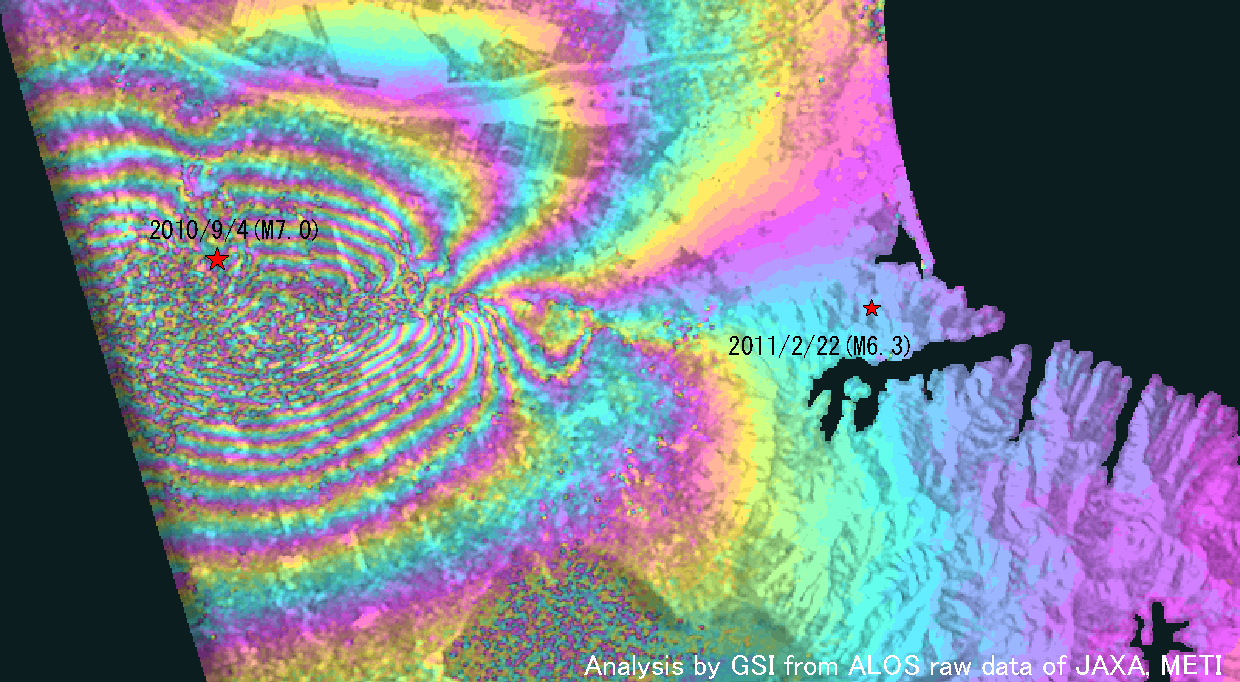
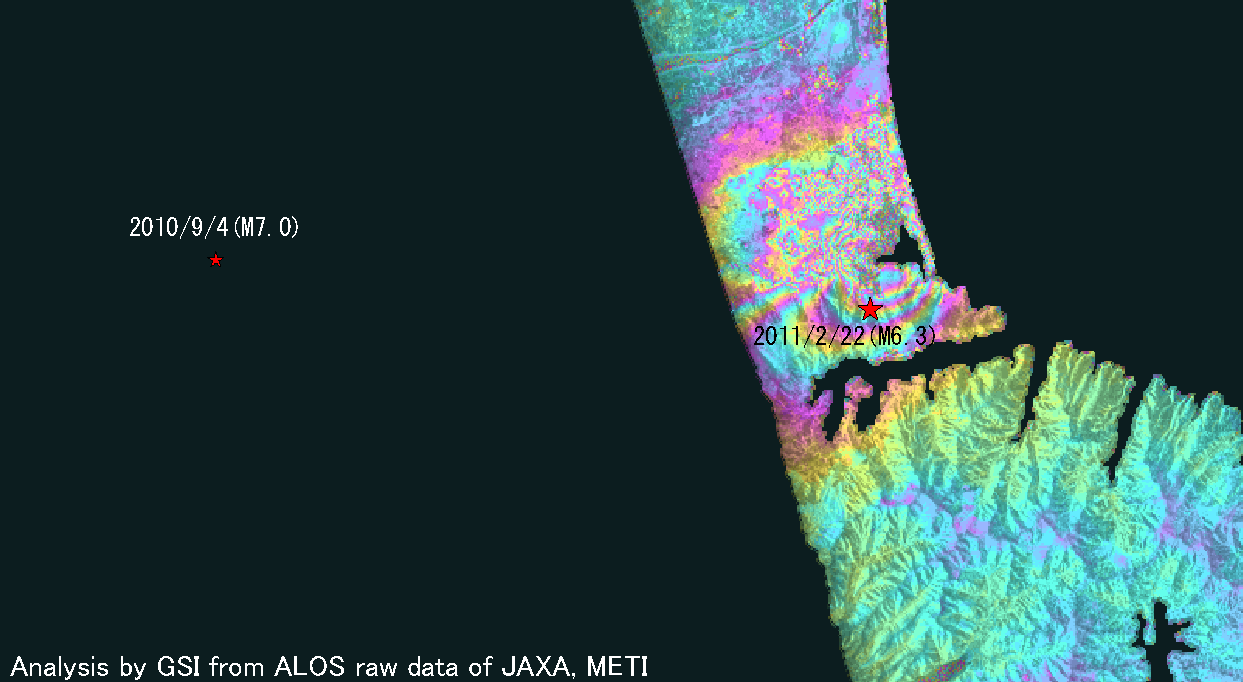
New Zealand's South Island Earthquake(2010/9/4.M7.0 ,2011/2/22,M6.3)
How to understand the SAR interferogram
| No. | Interferogram | Specifications | Comments | Down load |
|
|---|---|---|---|---|---|
| 1 |
2011.02.27up
|
Observation date | 2008/03/05 2010/09/11 |
There is the phase change around the center this image which may be caused by the earthquake.
*Accuracy of the used orbit data:High precision orbit data. |
|
| Observation Mode | FBS/HH FBD/HH |
||||
| Orbital direction | Ascending | ||||
| Off-nadir [degree] |
34.3 | ||||
| Path Frame |
336 6290-6300 |
||||
| Baseline[m] (Bperp) |
+36 | ||||
| Range (lat/lon) |
-43.8/-43.4/ 172.0/173.0 |
||||
| 2 |
2011.02.27up
|
Observation date | 2011/01/10 2011/02/25 |
There is the phase change around the center this image which may be caused by the earthquake.
|
|
| Observation Mode | FBS/HH FBS/HH |
||||
| Orbital direction | Ascending | ||||
| Off-nadir [degree] |
34.3 | ||||
| Path Frame |
335 6300 |
||||
| Baseline[m] (Bperp) |
-356 | ||||
| Range (lat/lon) |
-43.8/-43.4/ 172.0/173.0 |
||||