Questions on the basics of SAR Interferometry (InSAR)

Q1-1.What does "SAR" represent?
"SAR" is the acronym for Synthetic Aperture Radar.
Each word represents "Synthesis," "Aperture (Opening)," and "Radar." "Radar" is the acronym for RAdio Detection And Ranging.
Q1-2.What does "Interferometry" mean?
A radio wave, light, sound, or water ripples have the property of a wave, and when more than one wave of the same kind meet at the same point, each wave will intensify each other or cancel each other, due to interaction of waves. Such a phenomenon is commonly called "interference."
It is extremely difficult to measure the distance to the reflecting object by counting the numbers of peaks and troughs of the radio wave. However, it is relatively easy to know how much the object moved using the difference in the interference of two observations and by counting the peaks and troughs included in the difference. This technique is called "interferometry."
Q1-3.What does "Synthetic Aperture" mean?
When the object is detected using radar, resolution, i.e., how small are the objects that can be identified, is crucial.
In order to enhance resolution, it is necessary to narrow the radar beam by increasing the directivity of the radar antenna, but it requires a bigger antenna. When the Earth's surface is observed by radio wave emitted from the radar antenna on a satellite, the size of the radar antenna (aperture) required to obtain directivity for resolution of higher than 10 meters will be over 1 kilometer, which is unrealistic as a device on a satellite. Synthetic Aperture Radar is a technology to "synthesize" the "aperture" of the radar antenna by transmitting and receiving radio waves using a radar antenna installed on a moving aerial object (satellite, aircraft, etc.) in order to obtain a high-resolution image equal to that acquired by a large aperture antenna.
Q1-4.For what purpose is InSAR used?
At first, InSAR enables observation of displacement on the Earth's surface, which provides significant help.
When it is used to measure crustal deformation caused by an earthquake, the geological process of how the earthquake occurred can be found by estimating the activity of the underground faults from the distribution of ground surface displacement, and InSAR could be used for earthquake forecasting in the future.
In the case of volcanic observations, underground magma activities can be found from displacement of the ground surface, which will be used to predict volcanic activity. For surveys of Antarctica, the technology can be used to observe the movement of glaciers.
In addition to clarification of natural phenomena itself, this technology can be used to detect human-induced phenomena, such as subsidence caused by groundwater withdrawal.
With InSAR, it is also possible to measure topography (elevation) of the Earth's surface or to measure the distribution of water vapor in the atmosphere by improvements in observation and analytical techniques.
Q1-5.What is the difference between InSAR and other geographical surveys?
Measurement of displacement on the ground surface is possible by the other survey methods, such as GPS and leveling. InSAR is different from other methods in the following two points.
(1) 2-dimensional surveys are possible.
(2) No survey equipments required (at observation points) on the ground.
InSAR using satellite covers tens of kilometers square with one observation, and no survey equipments are needed in the area. So InSAR is possible even in the area which cannot be easily accessed. This is an advantage of InSAR that other ground survey methods cannot provide.
Questions for SAR interferogram
Q2-1.How to make out the SAR interferogram?
The results of InSAR analysis are mostly shown as pictures with colored fringes.
There is deformation in the area where the color turns from blue to red to yellow to green*1. At this time, note that rainbow-colors of fringes repeat cyclically, turning from blue to red to yellow to green and turning back to blue.
What is actually measured by SAR is the phase of the wave and not the absolute distance. The phase is represented by an angle from 0 to 360 degrees, and after one cycle, it returns to 0 degree.
A color in interference fringe pattern of the interferogram shows the difference in phases caused by the difference in distance between two observations of that point. For example, when the phase difference is zero, the point is shown in light-blue, 60 degrees in blue, 180 degrees in red, and so on.
A phase difference of 360 degrees means that the distance that a radio wave travels back and forth between a radar and the ground changes by just one wavelength.
A wavelength of the radar installed on ALOS is 23.6 centimeters, and the phase difference of 360 degrees is equal to a displacement of 23.6/2 = 11.8 centimeters*2. Similarly, when the phase difference is 60 degrees, it indicates a displacement of 23.6*(60/360)/2 ≒ 2.0 cm.
As such, the phase difference of a radio wave is proportional to the displacement, and the color of the fringe pattern shows the magnitude of deformation at that point.
However, the phase returns to zero after it reaches 360 degrees. This means that the displacement corresponding to the integral multiples of 360 degrees has the same phase. Responding to the indefiniteness in the phase difference of 360 degrees, the surface deformation obtained by InSAR also includes indefiniteness in the integral multiples of (the wavelength of radar wave)/2. This means that when a color at a certain point on the SAR interferogram of ALOS indicates a displacement corresponding to 5 centimeters, the actual displacement may be 5 ± 11.8 * n (n is a integer, 0, 1, 2 ⋯).
In order to resolve such indefiniteness, the following procedure is used. When the color change in the SAR interferogram starts from the point where the surface deformation is zero and ends in the point where the same color change is repeated after completing one cycle, it can be said that the latter point has the phase difference of 360 degrees, i.e., the displacement of 11.8 centimeters. Where the color change is repeated in 2 complete cycles, the displacement is double, 23.6 centimeters.
A technique to combine such a sequence is called as "Phase Unwrapping." With this technique, the absolute amount of actual surface deformation can be determined.
*1 The order of a color change will be different depending on the software used to display the interferogram.
*2 Because the data obtained by SAR include both the transmitted wave and the reflected wave from the ground surface, it is necessary to divide the displacement by 2 to obtain the actual displacement.
Q2-2.Why the SAR Interferogram is displayed in Rainbow Colors?
You may have seen a fringe pattern in the rainbow colors on a soap bubble. This is generated by light interference. The light reflected by the outside surface of the soap bubble coat and the light reflected by the inside surface interfere and a color corresponding to the thickness of the coat appears.
The wave used in InSAR is a radio wave which is commonly called a microwave, and even after interference, a fringe pattern is not visible to the human eye. So, we think that the fringe pattern of the SAR interferogram in rainbow colors is analogous to the same phenomenon of light interference.
Of course, the fringe pattern may be displayed in black and white gradations or in red and blue only, but when multiple colors are used, it is easy to recognize.
Q2-3.In the SAR interferogram, we can see a pattern like sprayed sand. What is this?
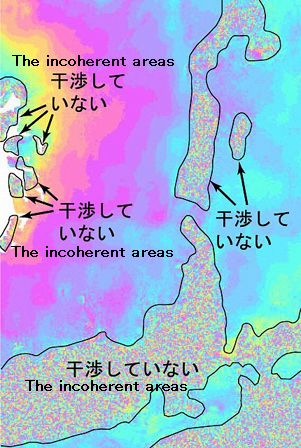
Areas without clear fringe patterns represent incoherent areas.
So that interference can occur, a pixel should reflect radio waves in almost the same condition between two observations. When displacement within one pixel is uniform, good coherence can be obtained, but when there is a rugged surface within the pixel or the surface changes by land formation, landslides, variations in plant cover, etc., two SAR signals cannot interfere with each other. In the case of a water surface, interference cannot occur because the water surface varies with the fluctuation of water.
Even if displacements within a pixel are small but the ground surface is inclined like in mountain areas, interference cannot easily occur when the distance between two observation positions of the satellite is large.
In such incoherent areas, the results are represented by random numbers in each pixel, and the color for such pixel differs from the adjacent pixels. Accordingly, incoherent areas show the pattern which is an aggregation of various color (like sprayed sand) as shown in the picture at the top left.
Q2-4.What is represented by the topography-like pattern as the background of the image?
A topography-like pattern is a superposition of a pattern showing phase changes and a pattern showing the intensity of the microwave reflected from the ground surface.
The intensity of the reflected wave is shown in the gradation in black and white, and a point with lower intensity is indicated in dark color and a point with higher intensity is a lighter color. Because the intensity of reflected wave varies with the topography and the condition of the ground surface, it looks like a topographic pattern.
The intensity of signals reflected from the water surface of rivers, oceans, etc., where the surface is constantly fluctuating or from the smooth surface of airport runways is very weak and indicated in a dark grey color. On the contrary, urban areas where buildings and structures are densely located reflect signals with high intensity, and it is indicated in white. Examining such differences in gradation, we can estimate the type of area from the pattern.
Q2-5.How much is the spatial resolution of the SAR Interferogram?
A SAR interferogram is an aggregation of pixels with colors. We can identify that there is a change by the cluster of pixels having a different color from the surrounding pixels. So the resolution depends on the pixel size.
The pixel size depends on the resolution of the data used for analysis and analysis method employed, so general statement is impossible, but when the data in high resolution mode of ALOS are analyzed, the size of one pixel is about 20 meters.
If the color of a cluster of more than 5 pixels is different from the color of the surrounding pixels, it can be generally said that a certain change is indicated. For example, when a cluster of 5 pixels (1 * 5, i.e., 5 pixels in a row vertically) has a different color, it indicates that there is a change in a range with a width of 20 meters and length of 100 meters. Accordingly, the spatial resolution is 20 to 100 meters in this case.
Q2-6.What is indicated in the area where pixels are extended horizontally?
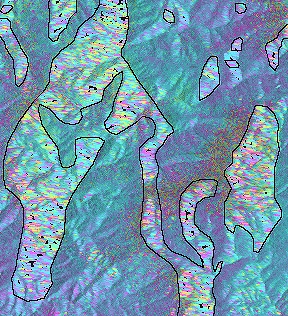
A slope that is facing directly in the direction of the radio wave beam is indicated closer to the satellite than the actual position in the SAR interferogram.
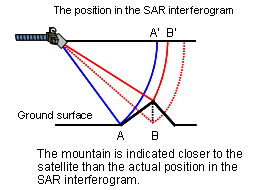
This effect is called foreshortening by the terminology for SAR. In such a point, geocoding is applied to extend the image. Therefore, as shown in the black box in the top left diagram, the pixels look like unnatural banding patterns as if extended in the lateral direction. Although the pixels are colored, it does not show interference.
Q2-7.Which projection method is used for SAR interferograms?
In the analysis of InSAR, the data are processed in the radar coordinate system obtained by the SAR satellite, and the results are converted to the ground-based coordinate system by using elevation data. This process is called "Geocoding." In this process, pixels holding information are rearranged according to longitude and latitude. So, the projection method employed in the SAR interferogram is the equidistant cylindrical projection or the equirectangular projection.
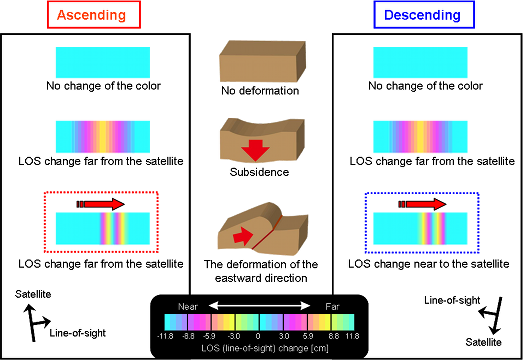
Q2-8.Which direction of displacement of the ground surface is measured by InSAR?
What InSAR measures is the displacement in the direction between the SAR antenna and the point on the ground surface (in the satellite's line of sight).
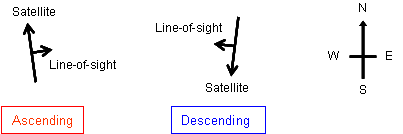
Observations by the SAR satellite are not made in the direction directly below the satellite but obliquely below the satellite, and there are ascending orbits where observations are made from the west and the descending orbit where observations are made from the east.
The ground surface will change in three dimensions (east and west, north and south, up and down) but InSAR can only detect a one dimensional displacement in the satellite's line of sight. So it is impossible to determine in which direction the ground surface is actually moved from the single SAR interferogram.
For example, when the observation is made from the east (descending orbit) and the displacement in the direction away from the satellite is observed, it can be decided that the ground sank or moved to the west, but it is impossible to determine whether the actual displacement is due to sinking, horizontal movement to the west, commingling of the both, or due to greater sinking that cancels horizontal movement to the east with resultant displacement which is in the direction away from the satellite. Additionally, detection of displacement in the north or south directions is impossible.
As such, it is difficult to determine the direction of displacement using a single SAR interferogram, but determination of the direction can be made by comparison of InSAR data with GPS measurement data, or by combining the several data from different directions (i.e. ascending and descending).
Q2-9.Why do an interferogram from ascending orbits and one from descending orbits look different?
As described in the answer to Q2-8, in SAR observations there are ascending orbits where observations are made from the west and the descending orbit where observations are made from the east.
Also InSAR can observe a one dimensional displacement in the satellite's line of sight.
So one SAR interferogram shows the displacement only in the direction where the ground moves close to or away from the satellite.
As a result, in spite of detecting the same deformation, an interferogram from ascending orbits may be different to one from descending orbits.
Q2-10.How much is the precision of InSAR measurements of ground surface displacement?
In principle, the precision of measurements itself can be on the order of millimeters.
However, due to the various errors caused by meteorological, observational, and other conditions, each SAR interferogram varies in precision.
Typically, the precision is within a few centimeters.
Q2-11.What is the largest error in InSAR?
It may not be appropriate to call it an error, but "incoherency" affects InSAR the most. In such a situation, there would be no result.
The InSAR errors arise from uncertainty of estimated orbit or topography, and the delay caused by disturbance of water vapor in the atmosphere, and the error due to delay caused by disturbance of water vapor is the largest because it cannot be removed easily. Particularly, when the water vapor is not uniformly distributed, it is difficult to remove the error by processing, and the ununiformity appears the change of colors in the SAR interferogram. Because of the high water vapor content around Japan, InSAR result may contain the error more than 10 centimeters in the bad summer weather. This must be taken into consideration.
Q2-12.What kinds of errors are caused by atmospheric water vapor in InSAR?
There are two major types of errors; errors caused by nonuniform water vapor distribution in the vertical direction and those caused by nonuniform water-vapor distribution in the horizontal direction.
The errors caused by water vapor distribution in the vertical direction show a pattern similar to that of topography. This is because the difference in the water-vapor appears as much as thickness of the atmosphere is different by the topography such as mountains or valleys when taking the difference between observations at distinct times when the water vapor is different. These errors can be removed to a certain degree using the correlation with altitude.
On the other hand, the errors caused by nonuniform water vapor distribution in the horizontal direction are generated randomly by local weather phenomena and are difficult to remove.
Because of the errors caused by the condition of water vapor distribution in the horizontal direction, the errors caused by the condition of water vapor distribution in the vertical direction may not be sufficiently corrected. In such cases, interferograms obtained at different times are compared or the mean value is obtained.
As to the errors caused by the condition of water-vapor distribution in the horizontal direction, the larger the spatial scale, the larger the amplitude becomes. Therefore, a difference of 10 cm at points 50 km apart is possible, whereas a difference of 10 cm at points several kilometers apart is unlikely.
Q2-13.Are there any ways to predict errors caused by the atmosphere?
ALOS flies over and observes Japan at around 10:30 p.m. along ascending orbits and around 10:30 a.m. along descending orbits. By checking the weather at these hours, whether errors caused by the atmosphere are contained in the SAR data can be predicted. Rain or high humidity increases the possibility of errors caused by the atmosphere. The atmosphere often affects data, especially during the muggy summer in Japan.
Q2-14.Does vegetation affect InSAR?
The radio waves of ALOS have a long wavelength. When the radio waves are beamed at trees, some waves penetrate leaves and the reflections from trunks or ground are received. Therefore, interference can take place in a forest area. In plowland, on the other hand, interference may not be attainable because the ground surface may change in a short time span by cultivation or water charged in the paddy field.
Q2-15.What kinds of tools or information are required for the InSAR analysis?
The following three are required for the InSAR analysis.
(1) Data
Data are obtained by satellites and cannot be controlled personally. However, there are countries other than Japan that are operating or planning the operation of InSAR satellites. The collected data can be purchased.
(2) Hardware (computer) with enough high performance and software (program) for analysis
As to the computer used for analysis, computing facilities for practical use were expensive before. However, the analysis can be performed using a regular personal computer these days. The analysis software products are still small in number but some are commercially available. Geospatial Information Authority of Japan (GSI) uses originally developed software called "GSISAR".
(3) Knowledge about InSAR
Although highly advanced expertise may not be required, knowledge in many different fields, such as remote sensing, image processing, meteorology, and crustal deformation, is required. In addition, the analysis flow and types of errors must be understood.
Questions on the published results obtained by InSAR
Q3-1.What types of data are used?
Unless otherwise specified, data obtained by PALSAR (Phased Array type L-band Synthetic Aperture Radar) on ALOS (Advanced Land Observation Satellite) operated by the Japan Aerospace Exploration Agency (JAXA) is used. As to the orbit information, the ALOS High Precision Orbit Information, which has the highest precision, is used unless otherwise specified. The DEM used for analysis is GSI 50m digital elevation data in Japan and SRTM 90m digital elevation data in other areas.
Q3-2.What software is used for analysis? Is it available to the public?
The software called GSISAR, which is originally developed by Geospatial Information Authority of Japan (GSI), is used for analysis.
The GSISAR was developed for internal use by GSI, so it is not distributed to the public.
Q3-3.How often is the analysis conducted?
The frequency of the routine analysis is about once a year for subsidence areas. The frequency of analysis for volcanic areas varies depending on the volcanic activity; once in several to six months in areas with intense volcanic activities. The analysis over a period of several years is planned for such areas as soon as the observation data are accumulated. As to other areas where minor deformations are expected, the analysis will be started in several years.
In the event of an earthquake, volcanic activity, or other disasters that can have a great impact on society, an urgent analysis will be immediately conducted, and the analysis results will be published.
Q3-4.Can I cite SAR interferograms?
To cite SAR interferograms published on this website, the submission of an application form is required. Click here for details of the application form.
The SAR interferograms published on this website were analyzed by GSI, the ALOS/PALSAR data is the property of the Ministry of Economy, Trade and Industry (METI) and Japan Aerospace Exploration Agency (JAXA). When citing the SAR interferograms generated from PALSAR data, explicitly indicate that interest and add the credit titles stating "Analysis by GSI from ALOS raw data of JAXA, METI" to the image. When the SAR interferograms other than those from PALSAR data are to be cited, add explicit credit titles according to the respective note.
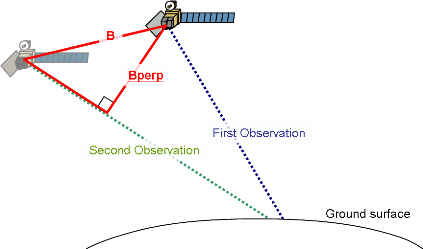
Q3-5.What is a baseline length?
The baseline length is the distance between the SAR satellite orbits for the first and second observations. A typical "baseline" is shown as B in the figure below.
In InSAR, the vertical component along the line of sight is more important than the baseline "B." This vertical component of the baseline "B" along the line of sight is referred to as Bperp. In InSAR, the longer the Bperp, the weaker the coherency.
The baseline lengths published on this website refer to the values of Bperp.
Q3-6.What is the "DEM error"?
The DEM (digital elevation model) is the data used in the InSAR image processing process to remove the fringes caused by topography (referred to as topographic fringes). When processing the data, if the ground surface geometries measured by SAR observation and DEM are different, the difference is shown as a phase difference in the image, which may appear like a false deformation. Because the phase difference is greater with the longer baseline length, a small DEM error can result in a great error in the image if the baseline is long.
In the chart below, the vertical axis shows the difference in the altitude direction between the ground surfaces obtained from the DEM and SAR observation data when the phase difference is 360 degrees (unit: m), and the horizontal axis shows the baseline length (unit: m). The chart shows that when the off-nadir angle is 34.3 degrees, the baseline length is 500 m and the difference in the altitude direction between the ground surfaces obtained from the DEM and SAR observation data is about 110 m, the phase changes by 360 degrees and the ground surface of that point appears to have changed by 11.8 cm in the SAR interferogram. Likewise, when the off-nadir angle is 34.3 degrees and the baseline length is 2,000 m, the phase changes by 360 degrees when the difference between the ground surfaces obtained from the DEM and SAR observation data is 20 m, and the ground surface appears to have changed by 11.8 cm in the SAR interferogram. In other words, the longer the baseline length, the greater the effect of a DEM error will be.
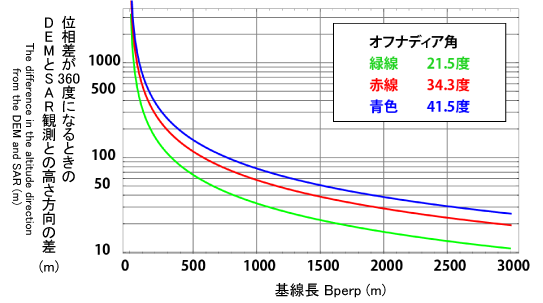
Typically, in the analysis of domestic areas, topographic fringes are calculated and corrected using the GSI 50m digital elevation data (50mDEM). The altitude precision is as high as 7.5 m. However, when the baseline length is 1,500 m and longer, a phase difference results even with a DEM error as small as a few meters.
For example, when the off-nadir angle is 34.3 degrees and the baseline length is 1,500 m, the difference in the altitude direction between the ground surfaces obtained from the DEM and SAR observation data which corresponds to the phase difference of 360 degrees (according to the chart) is about 40 m, and if the DEM measurement error is 7 m, phase change because of it is 11.8 cm * 7 m/40 m ≒ 2 cm, i.e., a small phase change caused by the DEM measurement error will appear in the SAR interferogram.
To verify whether the phase change in the SAR interferogram with a long baseline length is actually a change in the ground surface, it is necessary to compare the image with one with a short baseline length and check the same point for a phase change.
The data used for the GSI 50m digital elevation data was prepared before 2000, therefore phase differences can arise in areas where the altitude has changed substantially due to land development after the survey. Such areas can be checked through hearing investigation on the history of the land or compared with aerial photographs or topographical maps to confirm whether the land had been developed.
Q3-7.What does the "accuracy of the used orbit data" in the remarks field mean?
There are three types of ALOS orbit data with different creation time and precision: RARR_Predict, RARR_Determine, and High Precision.
The first to be created is the RARR_Predict. This is a predicted value obtained by an orbit determination method called RARR (Range And Range Rate) using the radar propagation time. The first image to be published in the urgent analysis on the GSI InSAR homepage is usually prepared with the RARR_Predict.
The RARR_Determine, which is created in a day to three days after the observation, is the value determined by RARR, and has a precision higher than that RARR_Predict.
The last is High Precision which is created in three to four days after the observation. High Precision are determined using GPS and other data, and they have the highest precision. Even if a RARR_Predict was used in an urgent analysis, a reanalysis is performed with High Precision to confirm the final result. Routine analyses are performed using High Precision unless otherwise specified.
(Creation time)
Earlier "RARR_Predict">"RARR_Determine">"High Precision" Later
(Precision)
Higher "High Precision">"RARR_Determine">"RARR_Predict" Lower
Q3-8.How are InSAR results compared with the amounts of deformation obtained by GEONET?
GPS detects ground deformation in three dimensions (east and west, north and south, up and down), whereas InSAR measures only in one dimension, along the straight line between a SAR antenna and the ground surface (satellite's line of sight). Therefore, the amount of deformation obtained by GEONET must be converted to the amount in the satellite's line of sight.
Q3-9.How are InSAR results compared with leveling results of subsidence areas?
Suppose all the deformations obtained from the SAR interferogram are subsidence deformations, with the horizontal-component deformation being zero. In this case, the amount of subsidence is obtained from the geometric relation between the incident angle of the radio wave to the surface and the direction of the surface deformation.
For example, when the off-nadir angle*3 is 34.3 degrees, the amount of subsidence will be 1.3 times the amount of deformation along the satellite's line of sight; when the angle is 41.5 degrees, the amount of subsidence will be 1.5 times the amount of deformation.
*3 Angle between the vertical direction (nadir) from the satellite and the direction of the satellite' s line of sight.
Q3-10.How are interferograms matched with geographic information?
Using the GIS software, please specify the latitudes and longitudes for the four corners of the SAR interferogram. This will match the data with a map or existing data.
GSI has verified that SAR interferograms can be matched with geographical information using GIS software products such as ArcView, PC-Mapping (including the control-station-based GIS system), Google Earth, and the "Denshikokudo" Web System (*4).
*4 A web server is required. See the portal site of "Denshikokudo" for details.