* These images may include radio wave propagation delay.
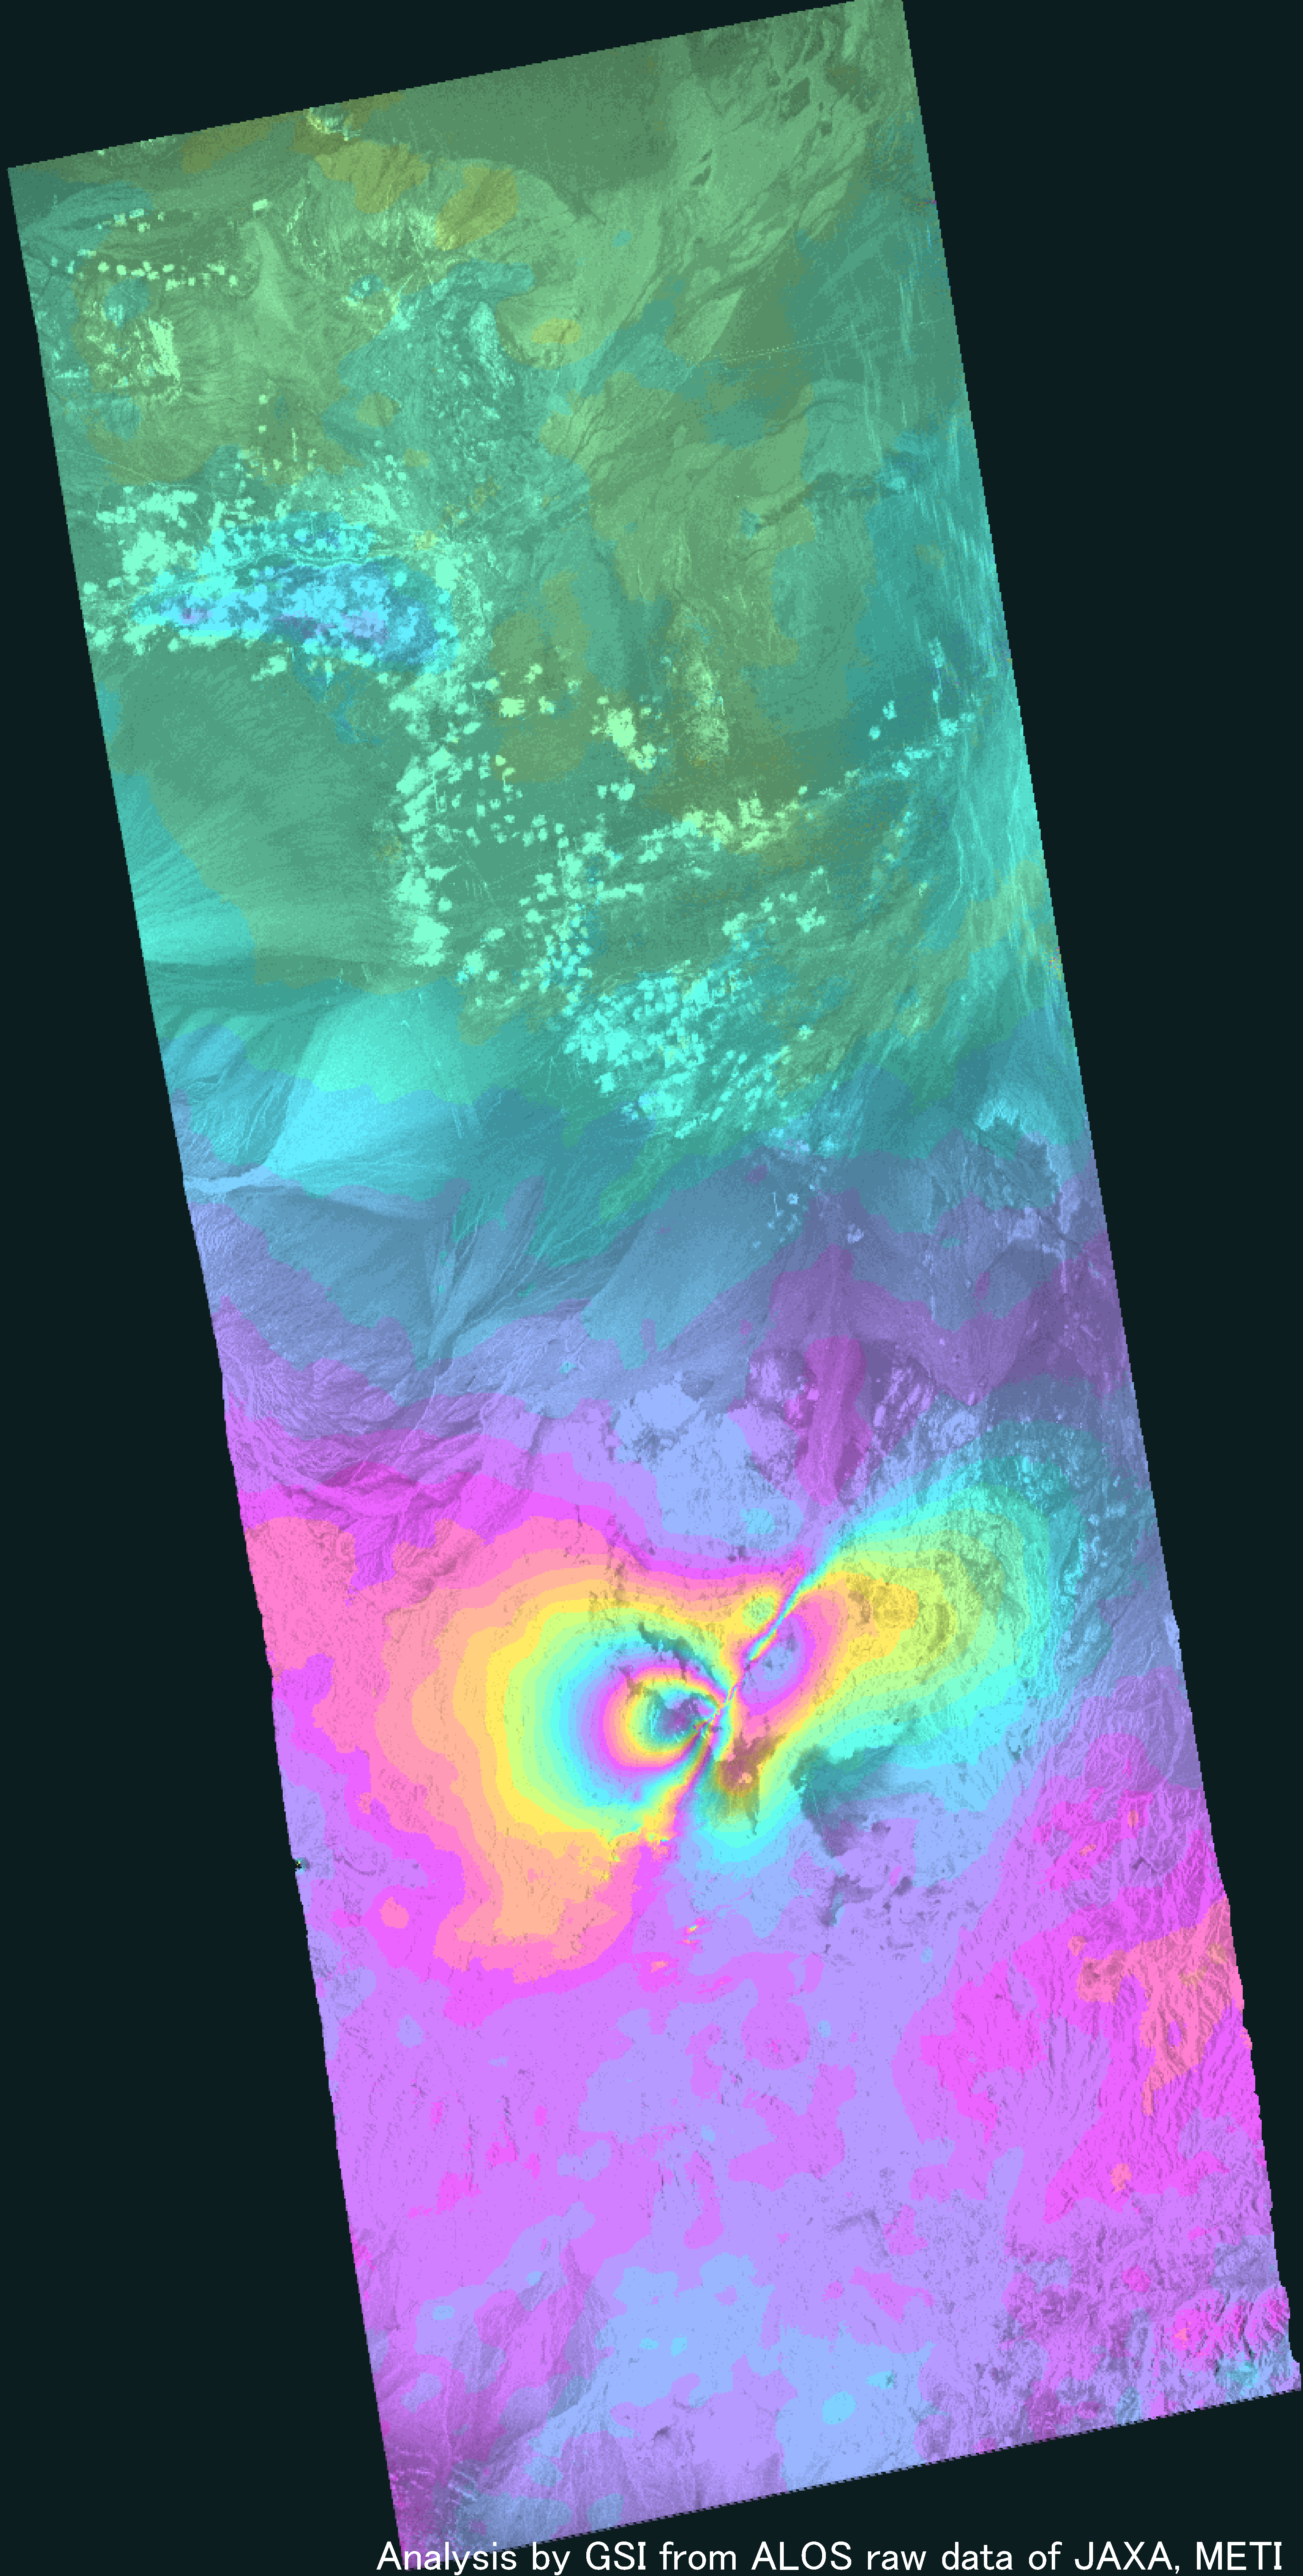
Southeast Iran Earthquake(2010/12/20,M6.5)
How to understand the SAR interferogram
| No. | Interferogram | Specifications | Comments | Down load |
|
|---|---|---|---|---|---|
| 1 |
2011.01.07up
|
Observation date | 2010/09/30 2010/12/31 |
There is the phase change around the center this image which may be caused by the earthquake.
*Accuracy of the used orbit data:High precision orbit data. |
|
| Observation Mode | FBD/HH FBS/HH |
||||
| Orbital direction | Ascending | ||||
| Off-nadir [degree] |
34.3 | ||||
| Path Frame |
559 550-560 |
||||
| Baseline[m] (Bperp) |
+179 | ||||
| Range (lat/lon) |
27.68/29.31/ 58.53/59.56 |
||||