* These images may include radio wave propagation delay.
* Click here for the position of Ascending interferograms.
* Also see "Southern Qinghai, China Earthquake", GSI Geography and Crustal Dynamics Research Center Topics.
* Click here for the position of Ascending interferograms.
* Also see "Southern Qinghai, China Earthquake", GSI Geography and Crustal Dynamics Research Center Topics.
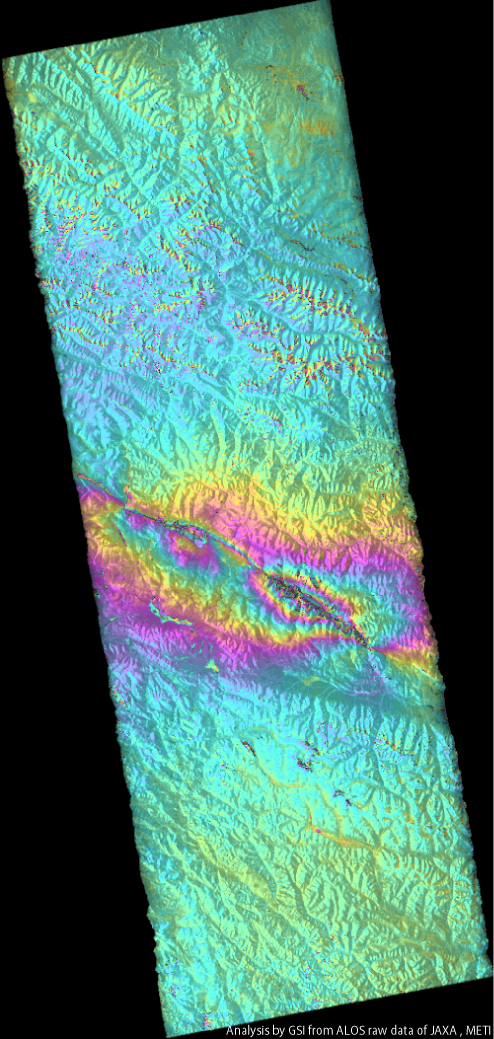
China Qinghai Earthquake(2010/4/14,M6.9)
How to understand the SAR interferogram
| No. | Interferogram | Specifications | Comments | Down load |
|
|---|---|---|---|---|---|
| 1 |
2010.04.28up
|
Observation date | 2010/01/15 2010/04/17 |
There is the phase change around the center this image which may be caused by the earthquake.
*Accuracy of the used orbit data:High precision orbit data. |
|
| Observation Mode | FBS/HH FBS/HH |
||||
| Orbital direction | Ascending | ||||
| Off-nadir [degree] |
34.3 | ||||
| Path Frame |
487 640-660 |
||||
| Baseline[m] (Bperp) |
+688 | ||||
| Range (lat/lon) |
32.14/34.28/ 96.09/97.36 |
||||