South Hyogo Prefecture Earthquake
January 17, 1995 M7.3
Contour map of deformation (2.5cm interval) drawing contour lines of the calculated absolute changes. Positive values represent upward or eastward movements of the surface deformation.
How to understand the SAR interferogram
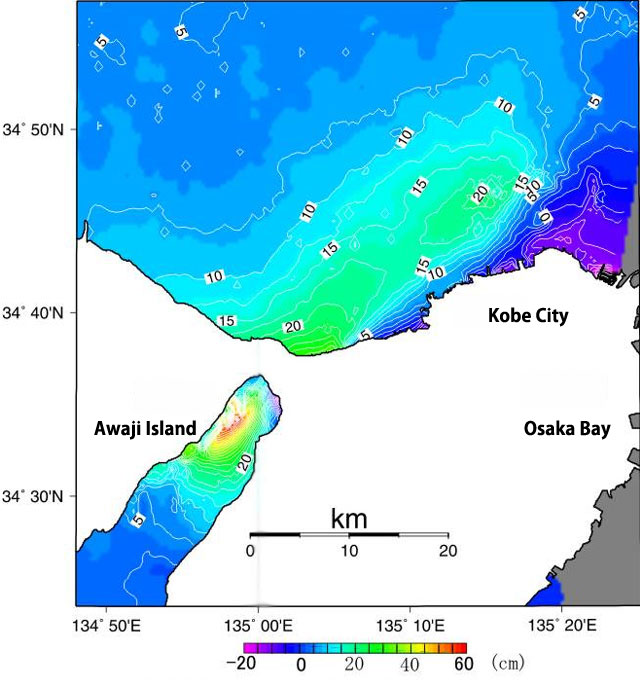

Contour map of deformation (2.5cm interval) drawing contour lines of the calculated absolute changes.
Positive values represent upward or eastward movements of the surface deformation.